Your track data, turned into lap time. A race dash and data logger for the car, an AI race engineer in the cloud, and every session — laps, lines, GPS and video — in one place. Pick a 5″ or 7″ display for the cabin, and change it any time at no charge.
Three steps, and no laptop on the pit wall.
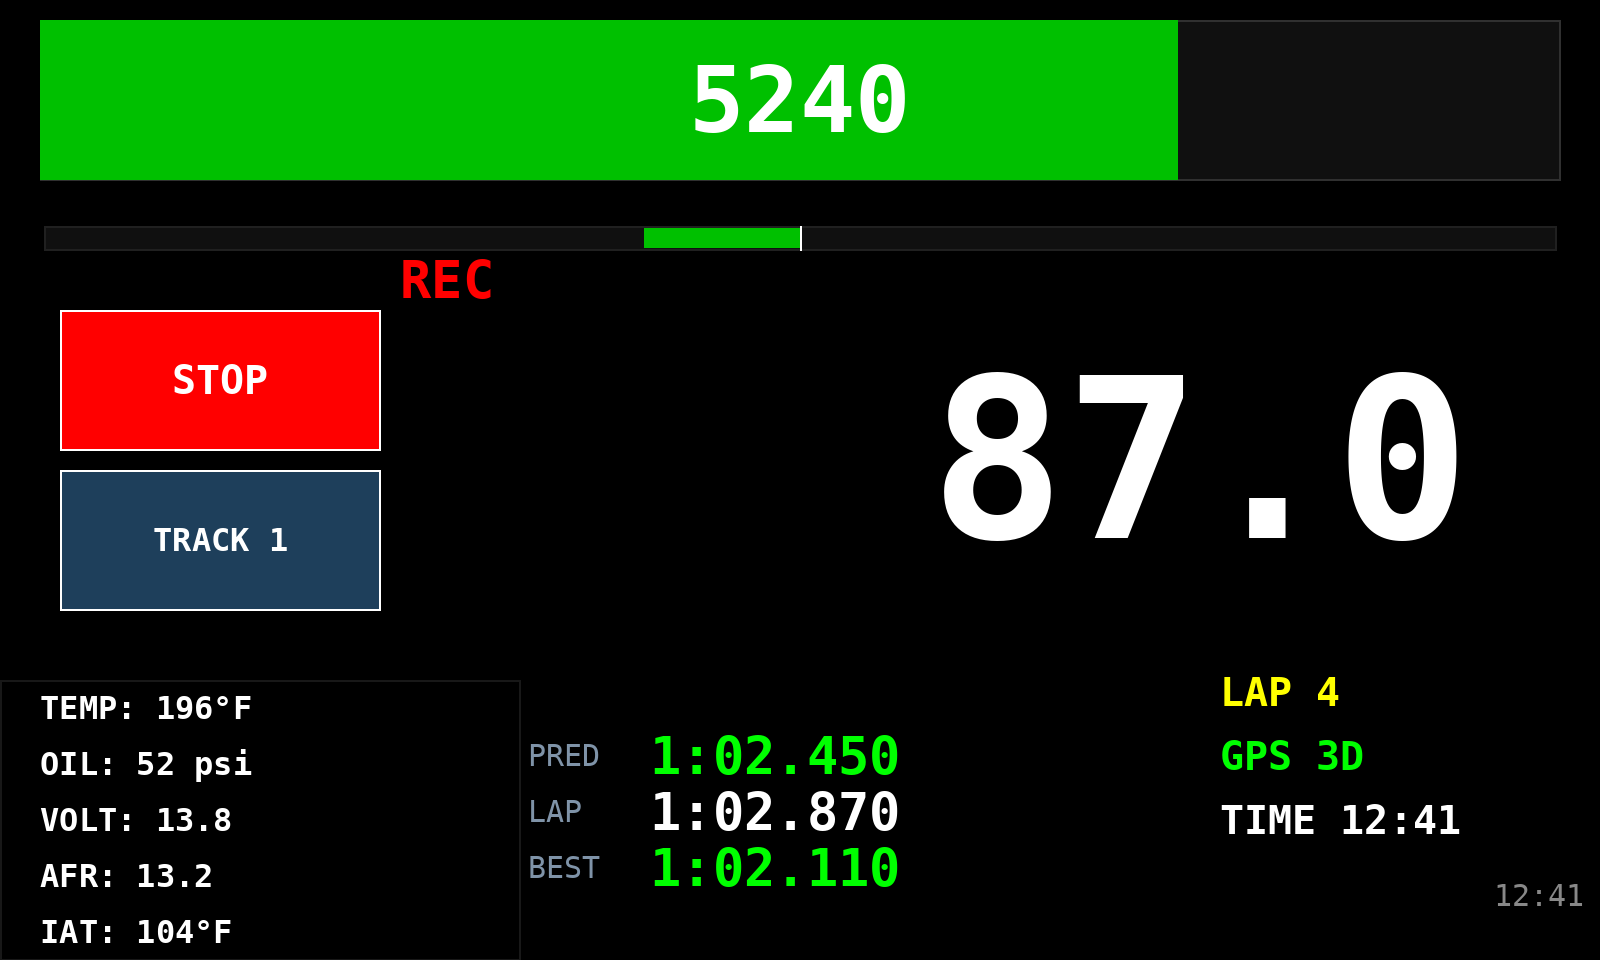
The dash shows speed, RPM band, shift flash, best and last lap, live delta and sensor warnings while it logs the session in the car.
Back in range, the car sends the session to the cloud over WiFi. Uploads resume by themselves if the link drops.
The cloud times your laps, maps your line, brings in your video and gives you corner-by-corner AI coaching you can act on before the next run.
The 7″ panel, shown at an angle. Sampled lap — this is the layout that runs on the display.
The cabin display, mid-lap. Every element is configurable, and the layout is arranged around the channels you actually run.
Available with the 5″ or 7″ display.
This is the part worth watching: circling a corner on the map and asking the AI about it. Real circuit, real session, straight off the Dash Cloud.
Apex (min) Speed — Best vs. Rest
First, flag two laps that aren't valid comparisons for this corner:
• Lap 3: 95.88s through a 677m section vs. ~230m/~6s for every other lap — you likely came in on an out-lap/there was traffic or a stop. Not comparable.
• Lap 6: min_mph of 36.2 vs. 81-83 mph everywhere else, with entry/exit speeds falling off a cliff after a 102.7 mph entry. That's a spin, missed apex, or big lockup — not a clean lap. Exclude it from technique comparison, but it shows the downside risk: a mistake here costs you ~45 mph of apex speed and the whole lap.
Clean-lap comparison (laps 4, 5, 7, 8):
| Lap | Entry | Min (apex) | Exit | Time | Peak Lat G |
|---|---|---|---|---|---|
| 4 (best) | 100.2 | 82.1 | 84.2 | 5.92s | 0.97 |
| 5 | 100.8 | 81.4 | 83.9 | 6.00s | 0.92 |
| 7 | 101.9 | 83.0 | 84.5 | 6.04s | 1.39 |
| 8 | 99.8 | 81.4 | 84.9 | 6.00s | 0.91 |
• Your best lap (4) is not the one with the highest apex speed — lap 7 carried 0.9 mph more through the apex but was 0.12s slower.
• Lap 4 won by getting through with less lateral load (0.97g vs 1.39g) while still posting a competitive exit speed. That's a sign of a cleaner, more efficient arc — not a harder apex.
• Worst clean-lap apex speed: 81.4 mph (laps 5 & 8) — 0.7 mph slower than your best (lap 4), costing ~0.08s here.
Bottom line on apex speed: you're only leaving ~1-1.5 mph on the table between your best and worst clean laps. The bigger swing is avoidance of the lap-6-style mistake, not micro-optimizing apex mph.
Turn-in Timing
The log doesn't have a direct turn-in/steering channel, so this is inferred from the lat-g and speed trace, not measured directly — take it as a hypothesis to test, not gospel.
What the pattern suggests:
• Your fastest lap (4) had the lowest peak lateral g (0.97) of the clean laps, yet still cleared the corner with a strong exit (84.2 mph) and the best time.
• Lap 7 spiked to 1.39g — 40%+ more lateral load — for only a marginal apex-speed gain, and it was slower overall. That signature (high peak g, not much apex speed to show for it) usually means an earlier, more aggressive turn-in that loads the tire hard early and scrubs speed, rather than carrying speed to a later apex.
Recommendation: Try turning in later/gentler — get the car rotated closer to a single, later apex rather than committing lat-g early. Based on lap 4 vs lap 7, that style is giving you a 0.12s advantage even with a slightly lower apex speed. Confirm this next session with a steering-angle or yaw-rate channel if you can log it — that will pinpoint the actual turn-in point rather than us inferring it from g-load.
Real exchange from the owner's account — the circled section is Turn 10, and the reply above is the AI coach's own answer, shown verbatim.
TURN 10 · LAP 3 · 1:30.079 · 110.8 mph
A genuine 2.0-mile Summit Point main-course lap, lifted from the car's own GPS. Turn 10, the corner the circle is on, is the last turn before the main straight.
Everything below is live today on the AI + Data Logging & Video plan; the AI plan covers the analysis and coaching side.
Corner-by-corner coaching written from your own session data, with history for every corner so you can see whether a change actually helped or just felt better.
Laps are detected and timed for you — no beacons, no tagging. Exclude a lap or rename it when you need to.
Put two laps on one map, compare the line, the speed and the time, and see exactly where the time is going.
Every run stored and organised by track, car and date, with the details behind each lap kept alongside it.
Your line drawn on a map, with corners numbered from start/finish and labelled left and right.
A 5′ or 7′ colour dash in the cabin: speed, RPM band, shift flash, best and last lap, live delta against your best, and sensor warnings that tell you when something is off before it costs you a session.
RPM, oil pressure, coolant temperature, AFR/lambda, GPS and motion sensors recorded on every run and uploaded with the session.
Bring your camera footage together with the session data so the video and the numbers tell the same story.
New features arrive over WiFi. No laptop, no cables, no reflashing at the track.
Send a read-only link to a single session — a driver, a coach or your engine builder — and revoke it whenever you like.
What goes in the car — included with an initial 12-month subscription, paid monthly.
| Component | What it does |
|---|---|
| Cabin display | 5″ or 7″ colour dash, built for daylight, configured around what you actually watch while driving. |
| Data logger | Logs the whole session in the car, including the channels behind every lap you later review in the cloud. |
| GPS | Position and speed for lap timing, the line map and the video overlay. |
| Sensor inputs | RPM, oil pressure, coolant temperature and AFR/lambda, plus motion sensing. |
| Connectivity | Built-in WiFi for session uploads and over-the-air updates. |
Installed and set up for your car, with the dash layout arranged around the channels you run. Choose the 5″ or 7″ display when your kit is set up — and if you change your mind, it can be swapped at any time at no charge.
Two straightforward monthly plans. The hardware is included — the kit comes with an initial 12-month subscription, paid monthly. Both plans include the dash software, the cloud account and over-the-air updates.
The AI race engineer and the full data logger, with the device included.
Everything in the $99 plan, plus the video kit with camera.
Not sure which one fits? Start with the $99 plan and add the video kit when you are ready — your sessions come with you. Either plan works with the 5″ or 7″ display, and the display can be changed at any time at no charge.